Baltimore Bridge Disaster: Supply Chain Impacts & Solutions
As the dust continues to settle from Baltimore’s Key Bridge calamity and reality sinks in, it begs a profound question: How do we survive when
Get our thought leaders’ transportation industry trends outlook for the year ahead. Watch the webinar to hear the latest logistics and supply chain advice from MercuryGate Co-Founder Steve Blough and Chainalytics VP-Transportation Kevin Zweier.
Explore some of the high points in our blog, Transportation Challenges and Logistics Trends in 2023.
Some supply chain analysts expect a “2023 hangover” continues to linger, leading to an economically soft first half. The expanded use of technology in supply chain operations, as well as increasing merger and acquisition activity is likely in the new year.
MercuryGate partners offer their outlook on transportation industry trends in 2023.
Redwood Logistics shares advice on 2023 Supply Trends to consider, including increased technology use, expectations for green supply chains and onshoring and nearshoring. Other transportation trend focus areas in 2023 explored in our certified reseller’s article are the potential for labor shortages, bottlenecks and backlogs.
The impacts of the driver shortage are not as straightforward as you might think, according to Chainalytics’ Kevin Zweier.
The December Supply Chain Digest from Rockfarm Supply Chain Solutions highlights industry news you need to know at the end of 2022 and a transportation outlook for 2023. A few take-aways:
Other notable year-end analyses and transportation industry trend outlooks on 2023 from news media include:
Here are our 5 most popular blogs of 2022:
First & Final Mile Logistics Capabilities Evolve To Meet Customers’ Modern Needs
Logistics Peak Season: 7 Steps To Improve Delivery Service
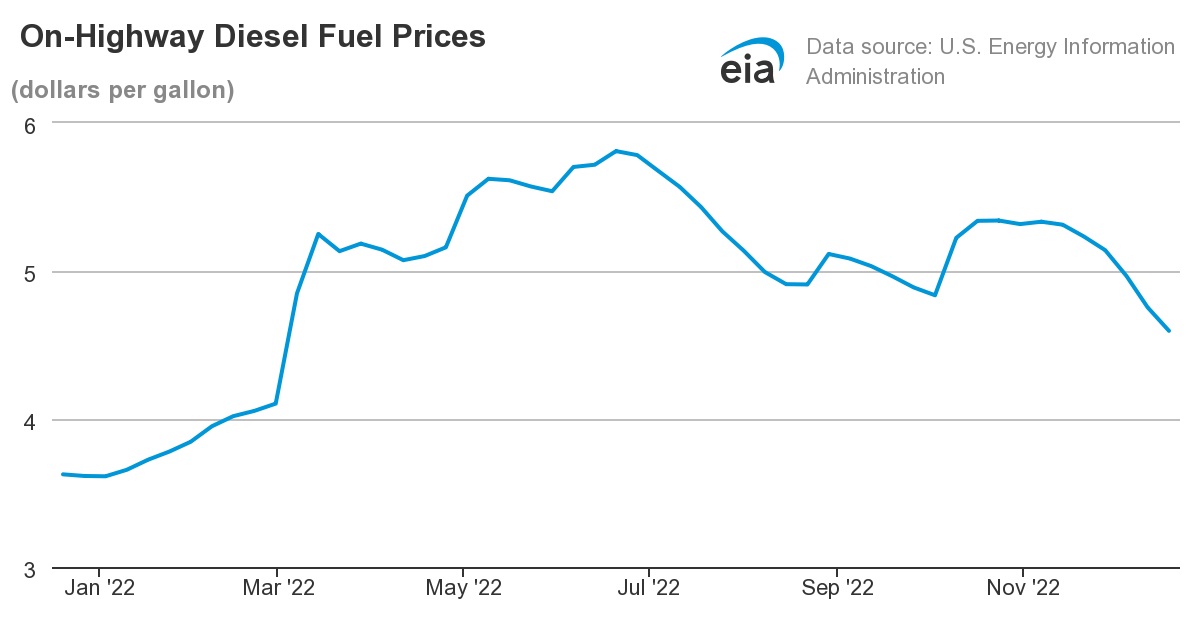
Dropping 15.8 cents from the prior week to $4.596 per gallon, the U.S. average for on-highway diesel fuel costs declined for the sixth consecutive week, according to the Dec. 19 from U.S. Energy Information Administration. Declines continue in all regions, with the steepest weekly drop – 22.6 cents – occurring in New England. Average on-highway diesel fuel costs remain highest in California at $5.437 per gallon. On-highway diesel costs average $4.205 in the Gulf Coast region, according to EIA’s Dec. 19, 2022 report.
In the final push toward 2023, economic uncertainty creates challenges in the Q4 transportation environment. Supply chain participants closely monitoring consumer, demand and transportation industry trends are positioned to optimize their business performance in the year’s last calendar quarter.
That’s especially true as holiday retail sales are expected to grow 6-8%, an estimated fortified by an October with 6% year-over-year gains. Both reflect a much slower rate than the 15% growth from November to January 2021. Expect e-commerce sales to grow 13-14%, year-over-year, reaching $260-264 billion, even as more shoppers return to brick-and-mortar stores.
Yet, only 10% of shoppers are expected to spend more this holiday season. When they do, purchasing decisions are based on price (65%), value (53%), and free shipping (51%), according to Gartner. Speaking of holiday shipping, meet these deadlines from USPS, FedEx, and UPS to ensure timely delivery on seasonal shipments.
Expectations for free or low-cost shipping promise more pressure on a transportation environment where declines in freight demand are driving down spot and contract costs. With September manufacturing growth at its slowest pace in 30 months, industry experts are beginning to predict a “return to normal” for the trucking environment despite ongoing equipment imbalances and driver shortages.
At the same time, ocean carriers canceling sailings from Asia aim to control demand volatility just a few months after premium container prices delivered record profits.
Watch our MercuryGate Minutes video to find out how you can make complicated freight shipping easier.
Download our eBook on multimodal freight optimization to discover how real-time data and streamlined processes can improve customer satisfaction. Keep scrolling for more industry indicators we’re monitoring during Q4.
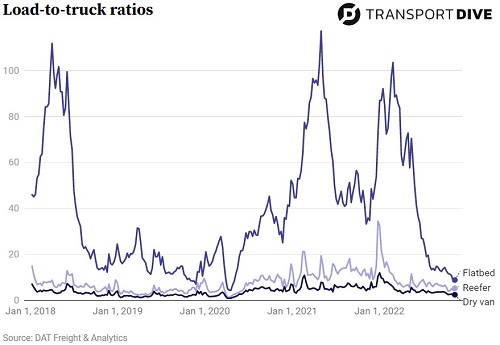
Load-to-truck ratios moving into November continue to hold steady, with modest week-over-week increases in flatbed, dry van, and reefer loads. Transport Dive
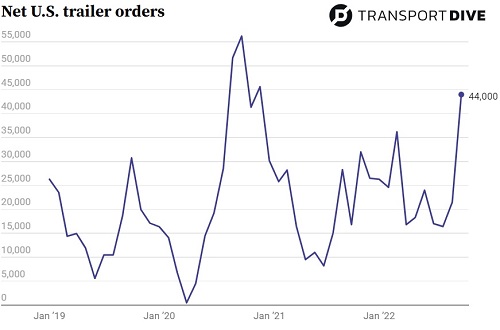
Preliminary trailer orders more than doubled from September to October, totalling 44,000 units, according to FTR.

Preliminary Class 8 orders jumped to 56,500 in September, more than double the 21,400 orders in August, according to FTR.
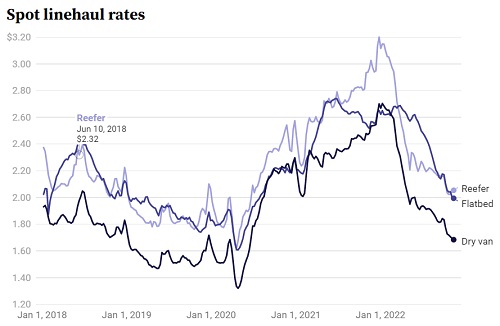
Spot rates declined slightly for dry van and flatbed during the weekend ending Nov. 19, according to DAT. A one-cent drop compared to prior week for both modes brought spot rates to $1.68 per mile for dry van transportation and $1.99 for flatbed. Reefer spot rates increased 1 cent to $2.05 per mile. Spot load posts declined 51.8% from October 2022 to October 2021. Conversely, spot truck posts increased 19.8% during the same period. From October 2021 to October 2022, dry van spot rates have declined 15.2%, flatbed spot transportation rates dropped 6.7%, and reefer spot rates declined 14.5%.
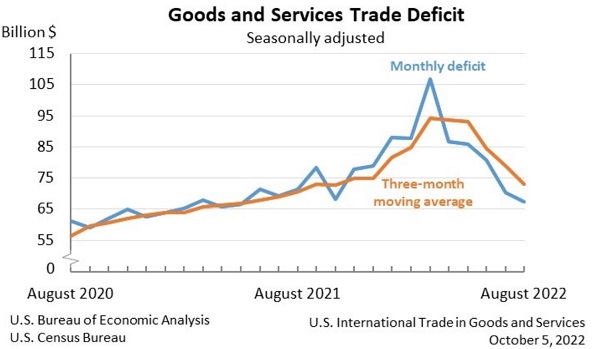
Steady decline continues in the international trade in goods and services deficit. August’s trade deficit dipped $3.1 billion to $67.4 billion. Over three months ending in August, average exports increased $1.5 billion; average imports decreased $4.7 billion. Year-to-date, exports are up 19.9%, and imports are up 21%. U.S. Census Bureau Economic Indicators
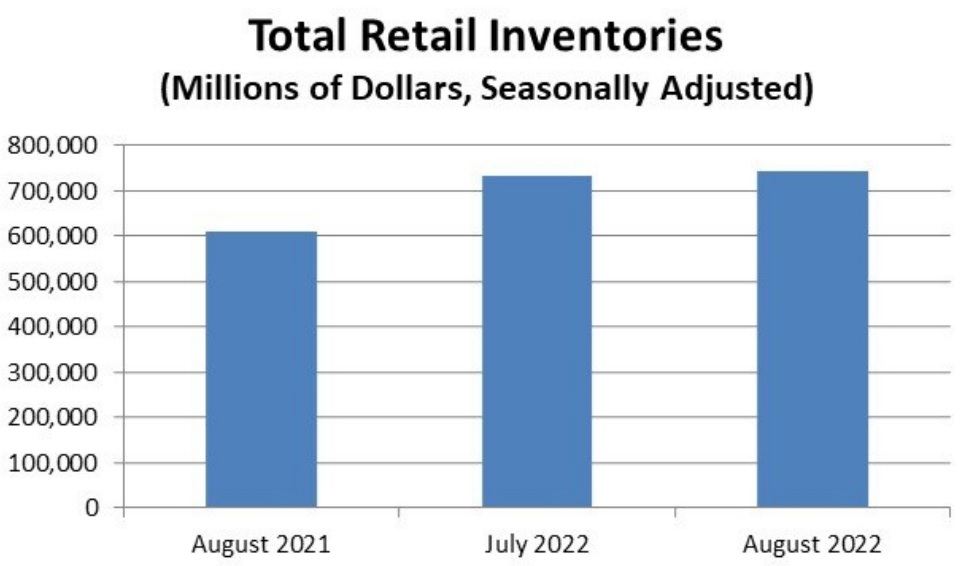
Retail inventories at August month-end were estimated at $741 billion, up 1.4% from July and up 21.6% from last year.
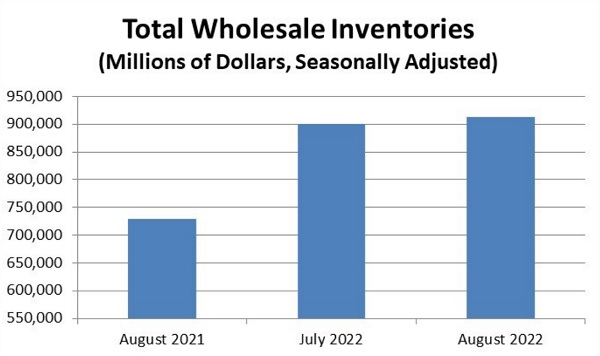
Wholesale inventories for August month-end were $913.1 billion, up 1.3% from July and up 25% from last year.
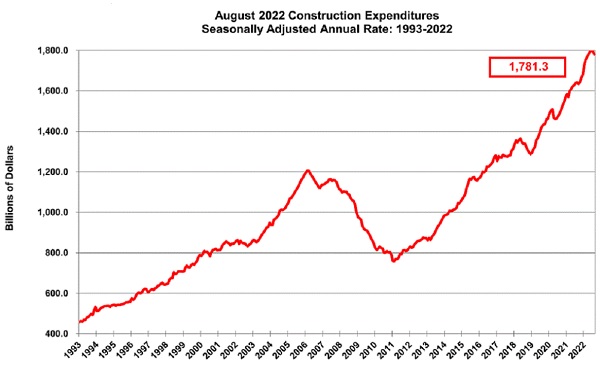
Construction spending continues to increase, up 8.5% in August compared to August 2021. Through the first eight months of the year, construction spending is $1,183.8 billion, up 10.9% over last year.
Freight demand is moderating heading toward the fourth quarter and peak shipping season. Trucking and rail measures both show reduced shipment counts (WSJ). At the same time, peak season surcharges and fees promise additional Q4 transportation costs – regardless of demand on the system. Some of those surcharges will be especially impactful on large volume shippers.
Most supply chain participants expect peak season to be “the same” or more active than in 2021.
Additional signs of broader economic change emerged in Walmart’s latest earnings news. The world’s largest retailer reports that U.S. comparable sales from sales and digital channels rose 6.5% in the quarter ending July 29. Revenue rose 8.4% to $152.86 billion. “The value of inventory was up 25% from a year earlier, but that’s lower than the previous quarter, and executives said they believe inventory has peaked,” WSJ reports.
Labor shortages continue to challenge supply chains at various points. Many organizations are exploring automation as an option to to fill operational gaps. Robot sales saw a 13% year-over-year increase in the food and consumer goods industry in the second quarter, according to the Association for Advancing Automation.
Looking into the second half of 2022, persistent challenges continue to affect cost and service across the global supply chain network. Get a deep dive into those challenges and solutions during our Q3 Transportation Trends and Smart Solutions Webinar with Steve Blough and Phil Melton. Here are a few topics our experts discuss …
CSCMP’s 33rd Annual State of Logistics summarizes the ongoing supply chain climate stating “… the logistics sector must simultaneously contend with the hangover of red-hot demand and worries of a revenue-diminishing and inventory-swelling downturn.” Further, “relative stability” may not return.
The same CSCMP report cited a 22% jump in transportation costs during 2021 – costs that are inspiring additional steps from companies focused on protecting their own margins.
FedEx will consolidate stations, delivery routes in $2B operational overhaul (Transport Topics). By fiscal year 2027, FedEx expects to operate 100 fewer stations, eliminate more than 10% of pickup and delivery routes overall and reduce millions of linehaul miles driven. FedEx expects the more efficient use of its separate networks will provide it with a $2 billion financial benefit each year.
Signs of temporary cost relief emerged with an expansion in trucking capacity during June. Notably, California produce volumes were at a 20-year low. However, port backups extending into freight rail supply chains add complications for importers managing the movement of freight into the U.S. (You can use this resource to track the speed, dwell, and cars of Class I railroads.)
Shipping backups on the East Coast and Gulf Coast ports threaten to keep up the pressure on North American supply chain infrastructure.
On the opposite side of the transportation industry trends coin, slowing growth for pricing won’t help carriers and drivers struggling with their operational costs – costs that are driving new market entrants out of business. Now, many shippers face record-high fuel surcharges and additional expenses, as those transportation providers try to cover some of those expenses.
At the same time, retailers nationwide face additional pressure from inventory challenges. Many of the largest retail chains are canceling vendor orders, offering discounts to customers, and aligning more closely with logistics service providers to keep the right inventory on hand, at the right time.
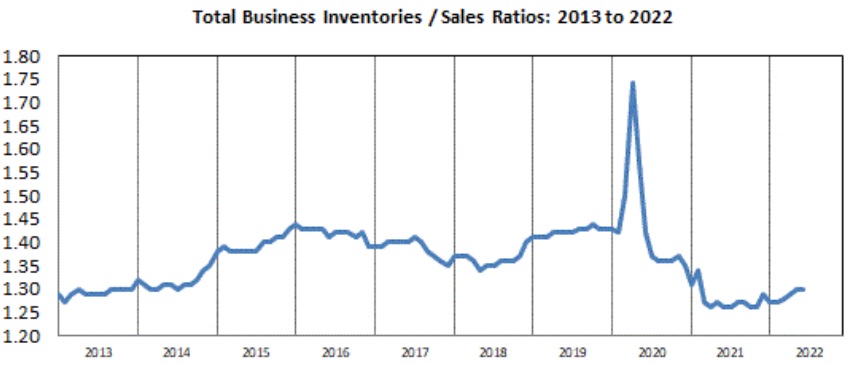
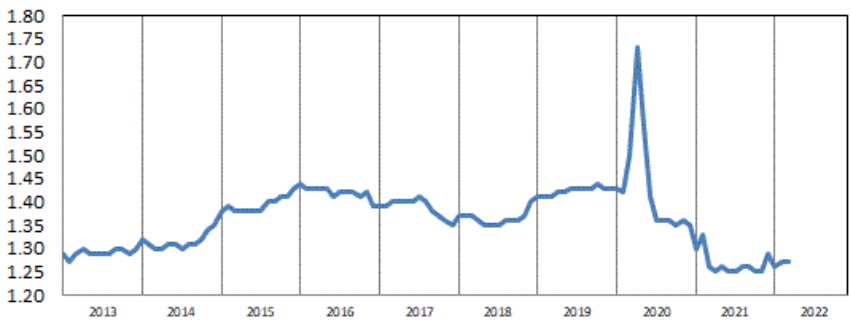
U.S. total business end-of-month inventories for June 2022 were $2,429.5 billion, up 1.4% from last month. U.S. total business sales were $1.858.1 billion, up 1.3% from prior month.
Meanwhile, cooling demand is sending ripple effects across the U.S. economy. One logistics gauge shows the U.S. economy will downshift into the second half. The Logistics Managers Index declined in June, the third straight fall from a record high point in March, and the lowest level since July 2020.
Manufacturing performance indicators for June from the Institute for Supply Management:
Real gross domestic product (GDP) decreased at an annual rate of 1.6% during Q1, after a Q45 uptick of 6.4%. Overall, 9 of 22 industry groups contributed to the Q1 decline in GDP.

Real gross domestic product (GDP) decreased at an annual rate of 0.9% in Q2 of 2022, according to the “advance” estimate released by the Bureau of Economic Analysis. The decrease in real GDP reflected decreases in private inventory investment, residential fixed investment, federal government spending, state and local government spending, and nonresidential fixed investment that were partly offset by increase sin exports and personal consumption expenditures. U.S. Bureau of Economic Analysis.
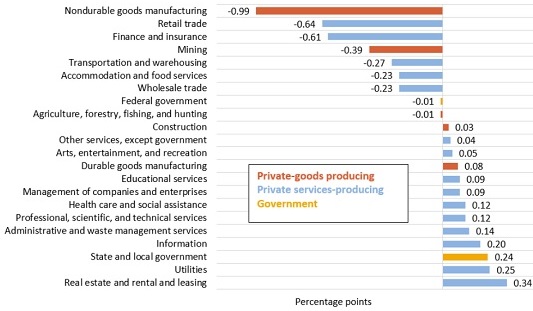
Real gross domestic product (GDP) decreased at an annual rate of 1.6% in Q1 of 2022, according to the “third” estimate released by the Bureau of Economic Analysis. In Q4 of 2021, real GDP increased 6.9%. In Q1, private goods-producing industries decreased 6.9%, private services-producing industries decreased 0.8%, and government increased 2%. Overall, 9 of 22 industry groups contributed to the first-quarter decline in real GDP. U.S. Bureau of Economic Analysis.
In this environment, Smart Transportation solutions allow supply chain participants to work faster and better. This is especially important in final mile delivery, where trends are rapidly changing but customer experience is still the priority. Even if those customers are willing to accept a longer wait in exchange for reduced environmental impact.

“Perspective: Winning Arguments to Attract New Drivers” from Transport Topics offers actionable advice at a critical time. A Supreme Court ruling could affect thousands of California truckers, potentially taking them off the road and creating new regional capacity challenges.
“How MercuryGate Helps Customers Manage Trucking Capacity” highlights MercuryGate product improvements that help our customers automate their response to common exceptions, like tender rejection, and deploy an arsenal of alternatives when loads need to be covered.
Setting the Path to Real-Time Visibility and Optimized Supply Chain Operations identifies five real-time visibility risks in freight transportation – and strategies to close any gaps.
Are you leading the race in 2022, stuck in mid-pack, or … facing DNF? Be alert to transportation industry trends and course conditions in Q2. The path ahead won’t be easy.
And whatever your position, put your strategy into top gear with guidance from MercuryGate and our partners.
Parcel volumes remain on upward trajectory after growing 6% last year, reaching 21.5 billion parcels shipped, according to Pitney Bowes. FreightWaves.
ATA: ‘There is more work than there are drivers.’ Transport Topics
Rising diesel costs are straining U.S. truckers and shipping operations as fuel prices hit record highs, climbing $1.50 per gallon in roughly two months. WSJ
Expert: ‘No End in Sight’ for diesel price inflation after price hikes in mid-March were among the steepest ever. Costs above $5-$6.50 per gallon could prevail through 2022. CCJ.
Why every American should care that diesel prices are surging offers opinion on the importance of diesel fuel in the U.S. economy. Of note, 97% of all Class 8 trucks use diesel fuel – and that’s one piece of an energy puzzle that also includes, railroads, agriculture and ocean shipping. FreightWaves.
NRF Forecasts Annual Retail Sales to Grow 6-8% to more than $4.86 trillion in 2022. Non-store and online sales are expected to grow 11-13% year-over-year, with GDP forecast to grow 3.5%.
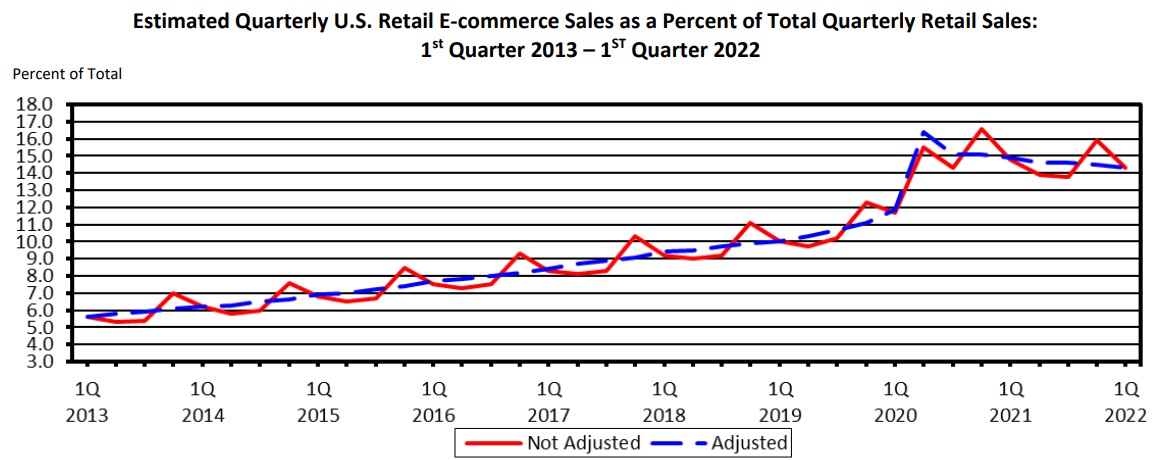
E-commerce sales in Q1 2022 totaled $250 billion (not adjusted for “seasonal variation.”) Online sales in Q1 accounted for 14.3% of total retail sales in the United States.
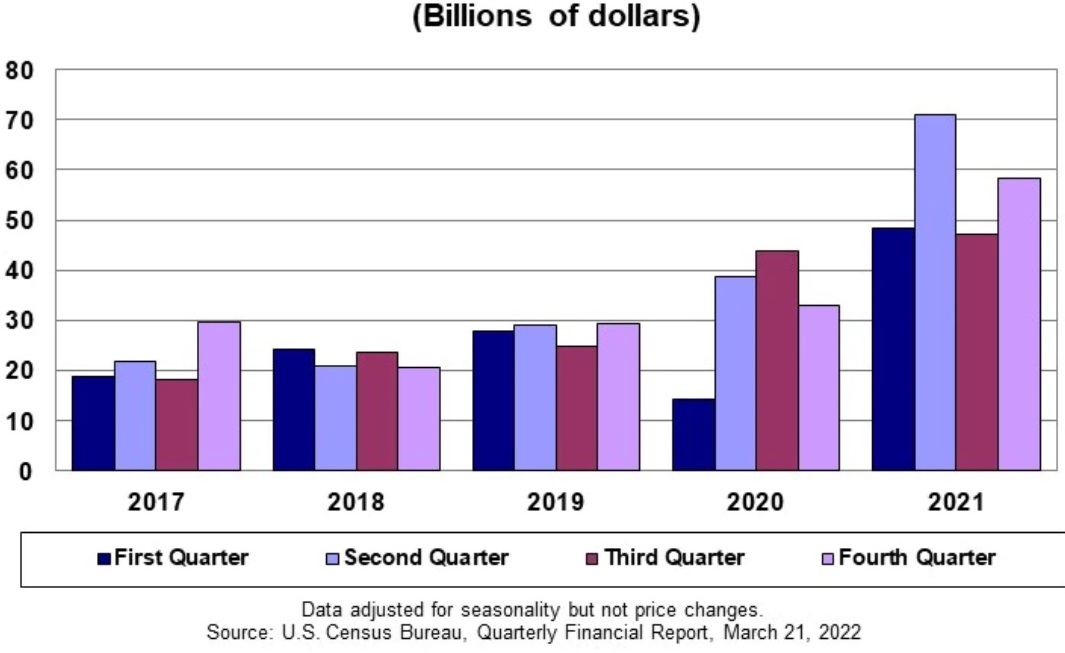
Seasonally adjusted after-tax profits of U.S. retail corporations (assets of $50 million+) totaled $58.3 billion in Q4 2021, up $25.2 billion from Q4 2020. Seasonally adjusted sales for Q4 2021 totaled $974.4 billion. U.S. Census Bureau Economic Indicators.
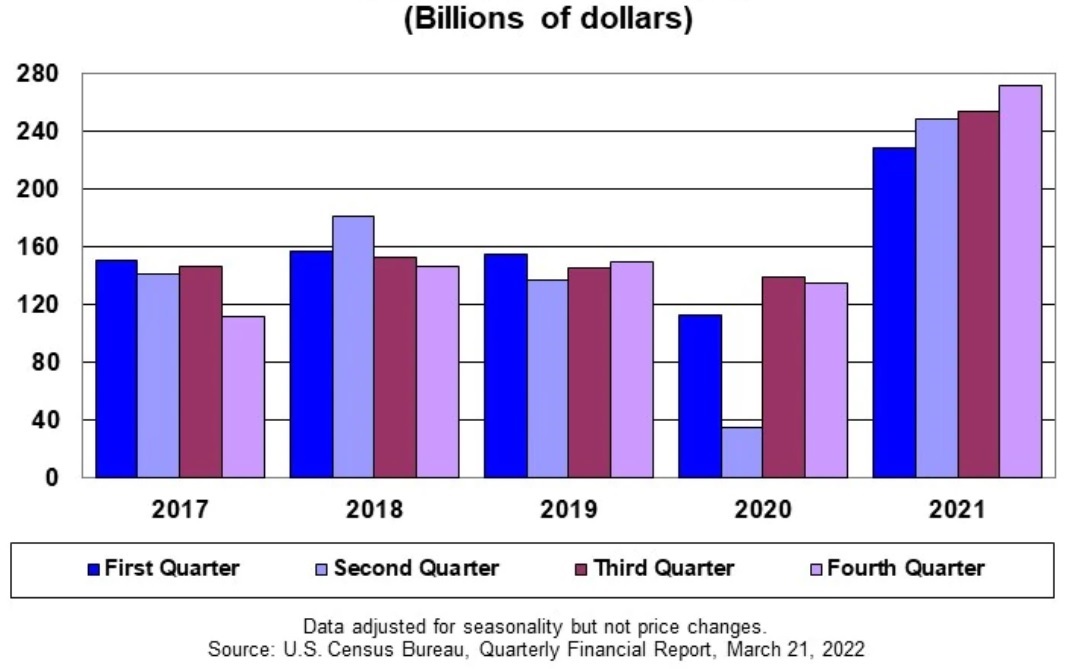
U.S. manufacturing corporations’ seasonally adjusted after-tax profits in Q4 2021 totaled $271.2 billion in Q4 2021, up $137.4 billion from Q4 2020. Seasonally adjusted sales for Q4 2021 totaled $1,931.0 billion, up $112.8 billion from Q3 2021. U.S. Census Bureau Economic Indicators
Shanghai lockdown reignites supply chain problems for U.S. companies. Disrupted businesses warn effects could continue into the summer. Wall Street Journal (subscription).
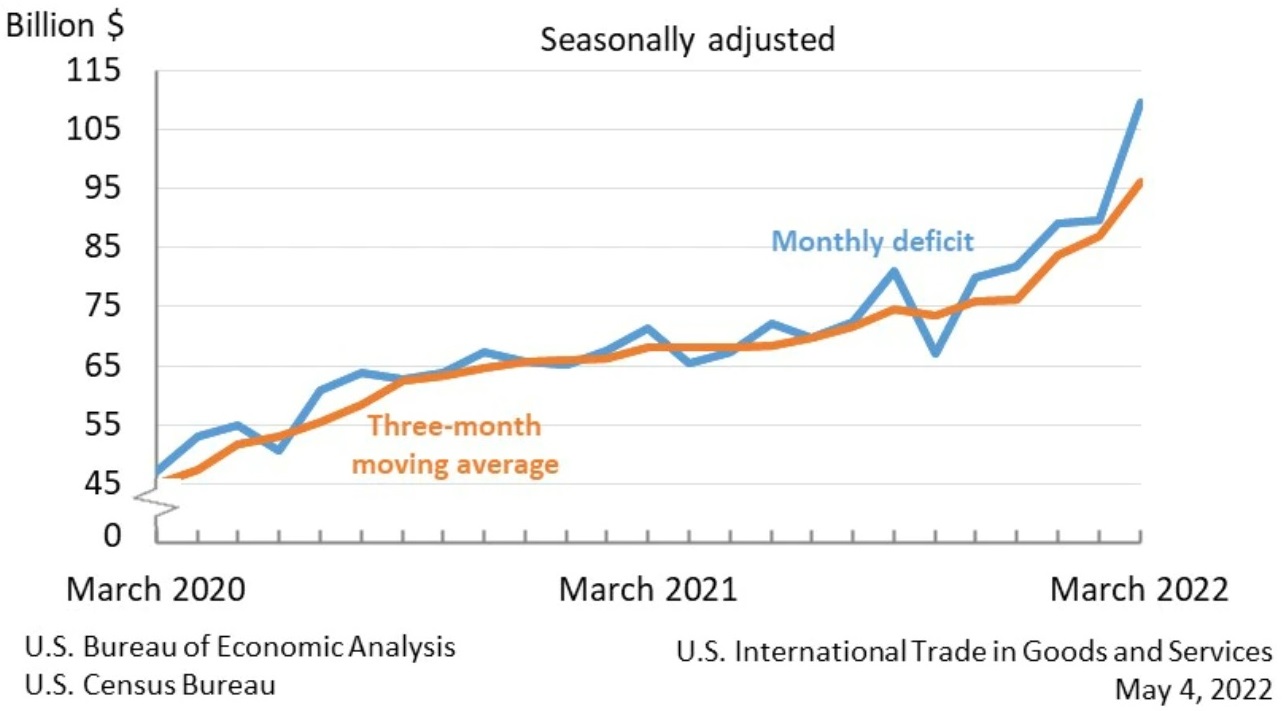
The United States international trade deficit in goods and services increased to $109.8 billion in March from $89.8 billion in February (revised), as imports increased more than exports.
Sanctions on Russia, War in Ukraine, and Covid in China Are Transforming Global Supply Chains. “As companies build more factories, in more locations, and buy parts and materials from a greater diversity of suppliers, the world’s supply chains are becoming more like supply webs.” Wall Street Journal (subscription).
Trucking’s Inflation Worries Go Beyond Fuel for motor carriers, especially when it comes to trailers. The Producer Price Index (essentially a measure of business-to-business inflation) for truck trailers and chassis is surging. Rising prices for materials – aluminum, steel, and lumber – are driving trailer cost increases. TruckingInfo.
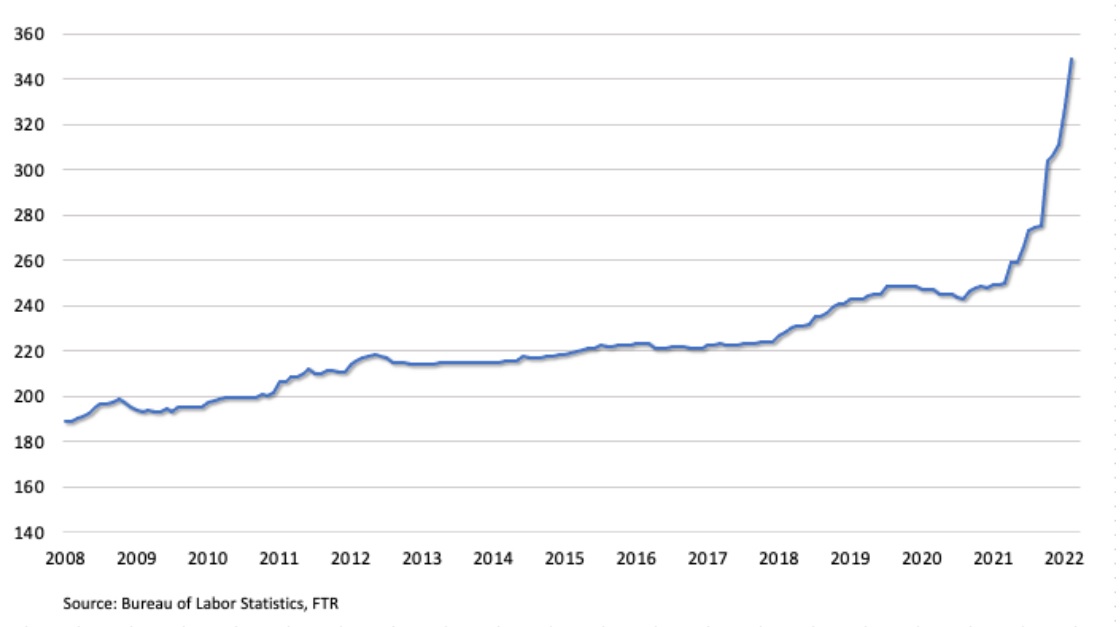
February saw the second-largest monthly increase (6.3%) in the trailer Producer Price Index, after the third-largest increase (5.5%) in January. The largest one-month PPI gain (10.5%) occurred in October.
Supply Chain Trends & Analysis: Manage Transportation Challenges in 2022. MercuryGate webinar recording features Co-Founder Steve Blough and supply chain expert Phil Melton. Watch it now for their insights on the past quarter – and the months ahead.
How Pallet Return Delays Ripple Through Supply Chains. Supply chain management trending toward ordering more goods and stockpiling inventory means more pallets trapped in warehouses – not moving goods for retailers and manufacturers. And pallet costs are climbing. DC Velocity.
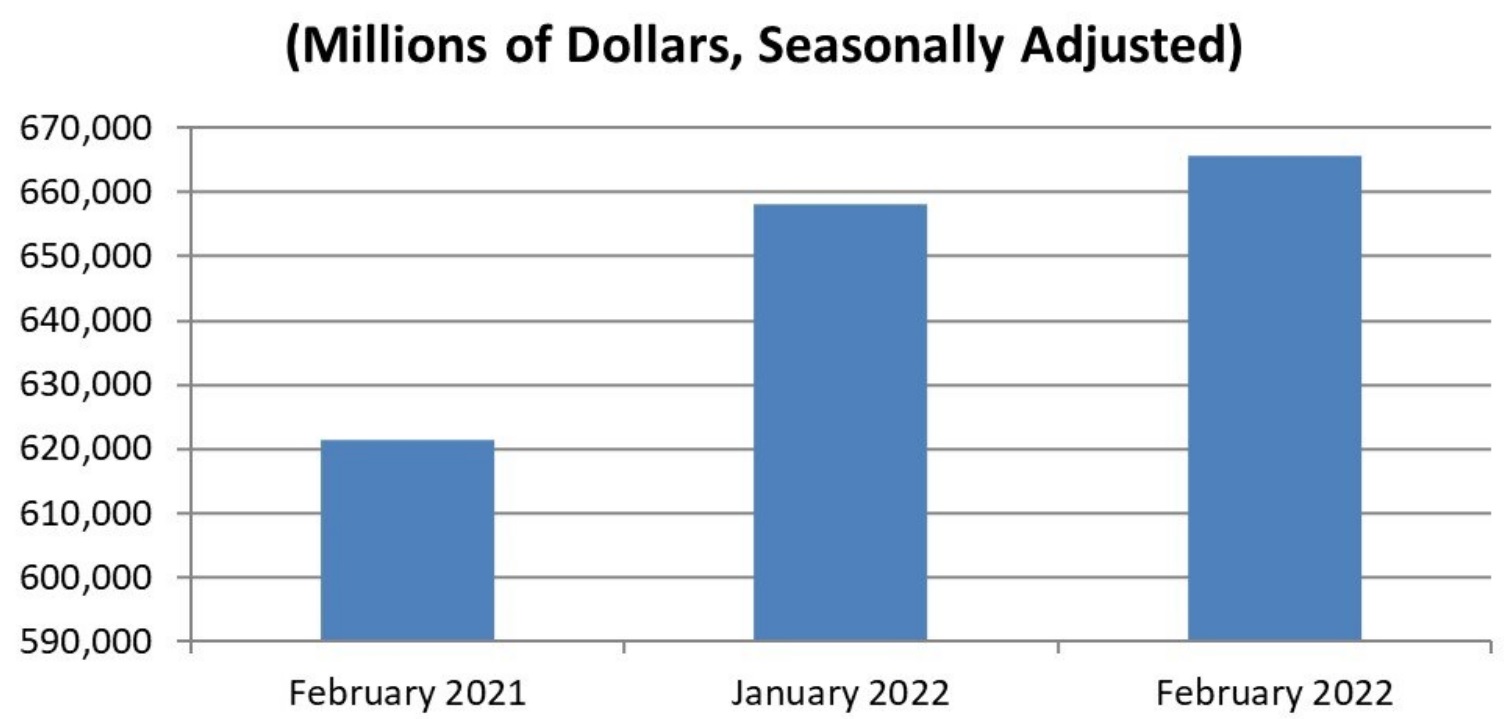
February 2022 end-of-month retail inventories were $665.6 billion, up 1.1% from January month. U.S. Census Bureau Economic Indicators.
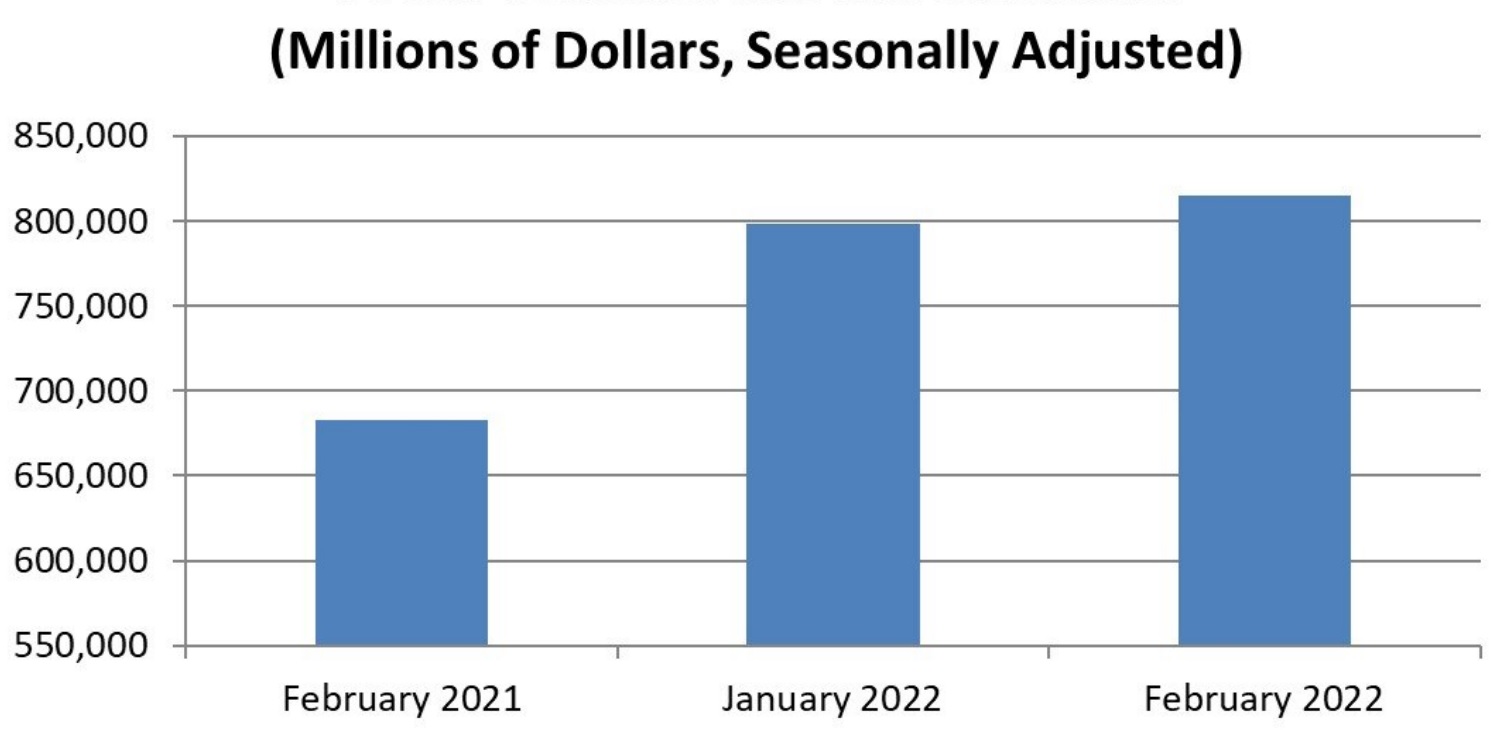
February end-of-month wholesale inventories were $814.8 billion, up 2.1% from January. U.S. Census Bureau Economic Indicators.
Act Now or Pay Later: The Costs of Climate Inaction for Ports and Shipping. “Without further action to reduce emissions, climate change impacts could cost the shipping industry an additional $25 billion every year by 2100.” RTI International.
2022 Supply Chain Benchmarking Report highlighst key factors shaping complexity in your transportation and supply network. Get the top 6 takeaways here.
Truckload Fuel Surcharges: An Overlooked Opportunity for Improvement? “Up until this point, fuel surcharges were seen as a cost of doing business, but we may start thinking more strategically about it to ensure we are hedging against increasing rates and costs,” said one Indago supply chain executive. Adrian Gonzalez, Talking Logistics.
Supply Chain Trends & Analysis: Manage Transportation Challenges in 2022. MercuryGate Co-Founder Steve Blough and supply chain expert Phil Melton share insights on 2022 to date. Watch it to get their advice for Q2. MercuryGate.
The Supply Chain Crisis Antidote? Digital ‘Demand Chain’ Management. With 72% of supply chains experiencing a negative impact from COVID-19, “Data analytics and digital collaboration platforms can help supply chain leaders improve the accuracy of their forecasts, identify and address problems more rapidly, and provide customers with a more cohesive experience …” Supply Chain Brain.
Voice Of The Customer In Modern TMS Platforms. “The ‘voice of the customer’ is more than a catchy buzz phrase. … It’s a direct line of communication and feedback from customers that’s useful in shaping the future of products and services provided by a company. Nicholas Wilson, MercuryGate.
‘Supply Chain as a Service’ Turns Empty Shelves into Extra Cash. “Consistent communication, collaboration, and transparency are key. They can be enabled through a third-party technology provider or a real-time data-powered platform. By ensuring a single source of truth for data, companies can experience greater trust, client retention, and transparency in relationship management.” Supply Chain Brain.
Selecting a 3PL – Are You and Your Potential 3PL Partner Meant for Each Other? “The organizations most in need of a 3PL probably don’t have a dedicated sourcing function in the logistics and distribution space. A properly developed approach to building the business requirements to share with likely 3PL partners can require an outsized amount of resources when it’s not something you do all the time.” Chainalytics.
A New Barometer of Global Supply Chain Pressures aggregates 27 different indicators to provide a summary of disruptions affecting the global supply chain. Among the take-aways: “… shipping cost indices have witnessed enormous growth since the beginning of the global recovery from the troughs of the COVID-19 pandemic.” Federal Reserve Bank of New York.
Parcel Delivery’s Phantom Peak-Mageddon reveals the scores for peak season parcel on-time delivery: UPS 96.9%, U.S. Postal Service 96.5% and FedEx 88.2%. Meanwhile, November non-store retail (online) sales rose 11.6% year-over-year, less than the gain reported between 2019 and 2020. FreightWaves.
2021 Put Logistics Technology on the Map “Global logistics is 12% of the GDP, or $9.6T. Yet, logistics tech is a mere $17.4B market worldwide – or a 0.18% investment in technology.” Alcott Global.
Investors are Piling into Supply Chain Technology highlights capital heading toward logistics technology companies – $24.3 billion in venture funding for start-ups through Q3 2021. The most attractive solutions? “Focused tools for operations,” such as “matching freight loads to transportation capacity and mapping out cost-effective routes to move goods.” Wall Street Journal (subscription).
What do Trucking Conditions Look Like in 2022? highlights expectations for continued strengthening of transportation demand through 1H 2022, with contract truckload rates expected to increase year-over-year. Commercial Carrier Journal.
Top LTL Executives see Continuing Upward Rate Pressure on Shippers in ‘22. How much more costs will climb “depends on individual shipper demands, their freight characteristics and how their tonnage fits into a carrier’s overall freight demand scheme.” Logistics Management.
All Eyes on the Transpacific as Container Rates Look Set to Rise Again with outbreaks of COVID-19 variant Omicron jeopardizing operations at Asian factories and ports, as well as ports on the U.S. West Coast. TradeWinds.
Year-over-year Producer Price Index Final Demand on Transportation and Warehousing climbed 15.7% in January 2022. Total year-over-year PPI Final Demand for all segments climbed 9.7%. U.S. Bureau of Labor Statistics.
“You cannot avoid disruptions in the supply chain, but when your CEO asks you ‘Where is our cargo currently?’ you need to have a good answer available.” The Past 20 Months in Supply Chain: What Have We Learned? Adrian Gonzalez, Talking Logistics.
“By embracing the interplay between AI and BI, businesses can receive additional value and automation from their data and gain great strategic impact.” The Dirty Little Secrets of Business Intelligence: Shaping Corporate Strategies, EnVista.
The Logistics Tail That Wags the Supply Chain Dog shares 3 things logistics leaders must do in 2022 to “continue to leverage their newly found influence and lead their supply chain colleagues through this period of transition.” David Gonzalez, Gartner Supply Chain.
“There are more than 500 different claim causes that can affect a shipment. To avoid the lost costs of goods affected by claims, having a clear concise freight damage claim process is essential.” How The Right Freight Claims Process Works: Best Practices To Know, Joe Celestina, MercuryGate International.
Visualize Your Savings
Simplify Transportation
Personalized or On-Demand
Software For Your Business
Read, Watch & Listen
Industry & Product Info
Stay Up-To-Date on MG
Watch On-Demand
As the dust continues to settle from Baltimore’s Key Bridge calamity and reality sinks in, it begs a profound question: How do we survive when
Product News & Updates
Get Product Help
Train & Upskill Users
Find a MG Partner
About MercuryGate
Current Openings
Connect In-Person
Get In Touch
As the dust continues to settle from Baltimore’s Key Bridge calamity and reality sinks in, it begs a profound question: How do we survive when
This website uses cookies so that we can provide you with the best user experience possible. Cookie information is stored in your browser and performs functions such as recognising you when you return to our website and helping our team to understand which sections of the website you find most interesting and useful.
Strictly Necessary Cookie should be enabled at all times so that we can save your preferences for cookie settings.
If you disable this cookie, we will not be able to save your preferences. This means that every time you visit this website you will need to enable or disable cookies again.
More information about our Cookie Policy