TMS Control Tower Unlocks Operational Visibility
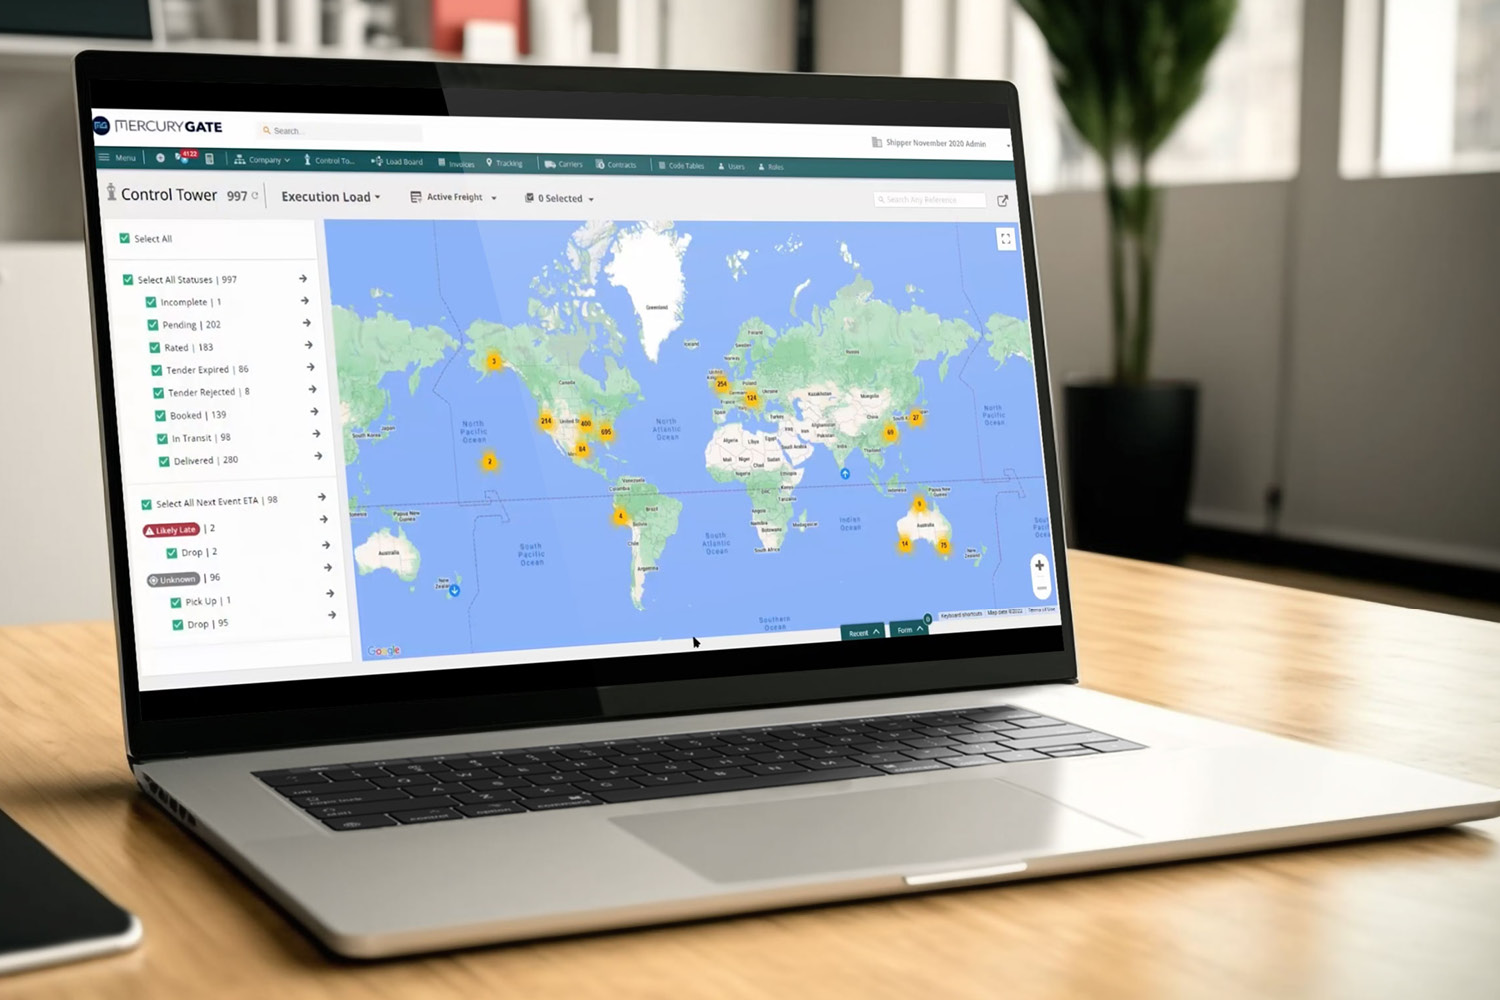
Control Tower Map Visualizes Shipments in Motion
Tracking shipments by status is fundamental, but TMS control tower visualization delivers the next-level supply chain visibility you need to manage by exception. With detailed map views illustrated by shipment events, transportation managers get a clear picture of what is coming through the network – and the regional service providers who are ready to move freight.
Leverage control tower tracking and detailed visibility to inform your decisions when fulfilling orders, planning network activities, or responding to localized disruptions – like weather events. You will improve collaboration with network partners, enhance communications with customers, and increase overall service levels.
Control Tower View Drives Supply Chain Coordination
Single Source of Truth
Instant Visibility and Action
Proactive Exception Management
What is within TMS Control Tower View?
Track scheduled pickups and deliveries using map and detail icons that give you visibility to shipping orders within your selected window.
Identify events – pickups or deliveries – at risk for being late or likely late. Access additional details to understand the disruptions and whether alternate routes are needed.
Direct your attention to quotes that are Ready to Accept, About to Expire in the next 4 hours, or Expired, and get order details for retendering or processing.
Control Tower Visibility Aligns Operations
Challenge: Global medical products and solutions company managing a vast logistics footprint sought a solution that would help it unify operations.
Solution: Enterprise TMS control tower provides end-to-end supply chain visibility required for making data-driven transportation decisions.
Results: Streamlined processes across a global supply chain and achieved network-wide improvements in carrier management and internal reporting.